


It's easy to think of market volatility as something temporary - a phase that eventually passes. But as this week's chart shows, the 2020s are shaping up to be one of the most consistently volatile decades in market history. This chart adds up every single day the S&P 500 has moved 1% or more in either direction. And even though we're only halfway through the decade, the 2020s already have more 1% days than the entire 1950s or 1960s - and are on pace to eclipse most full decades since 1950. |
|
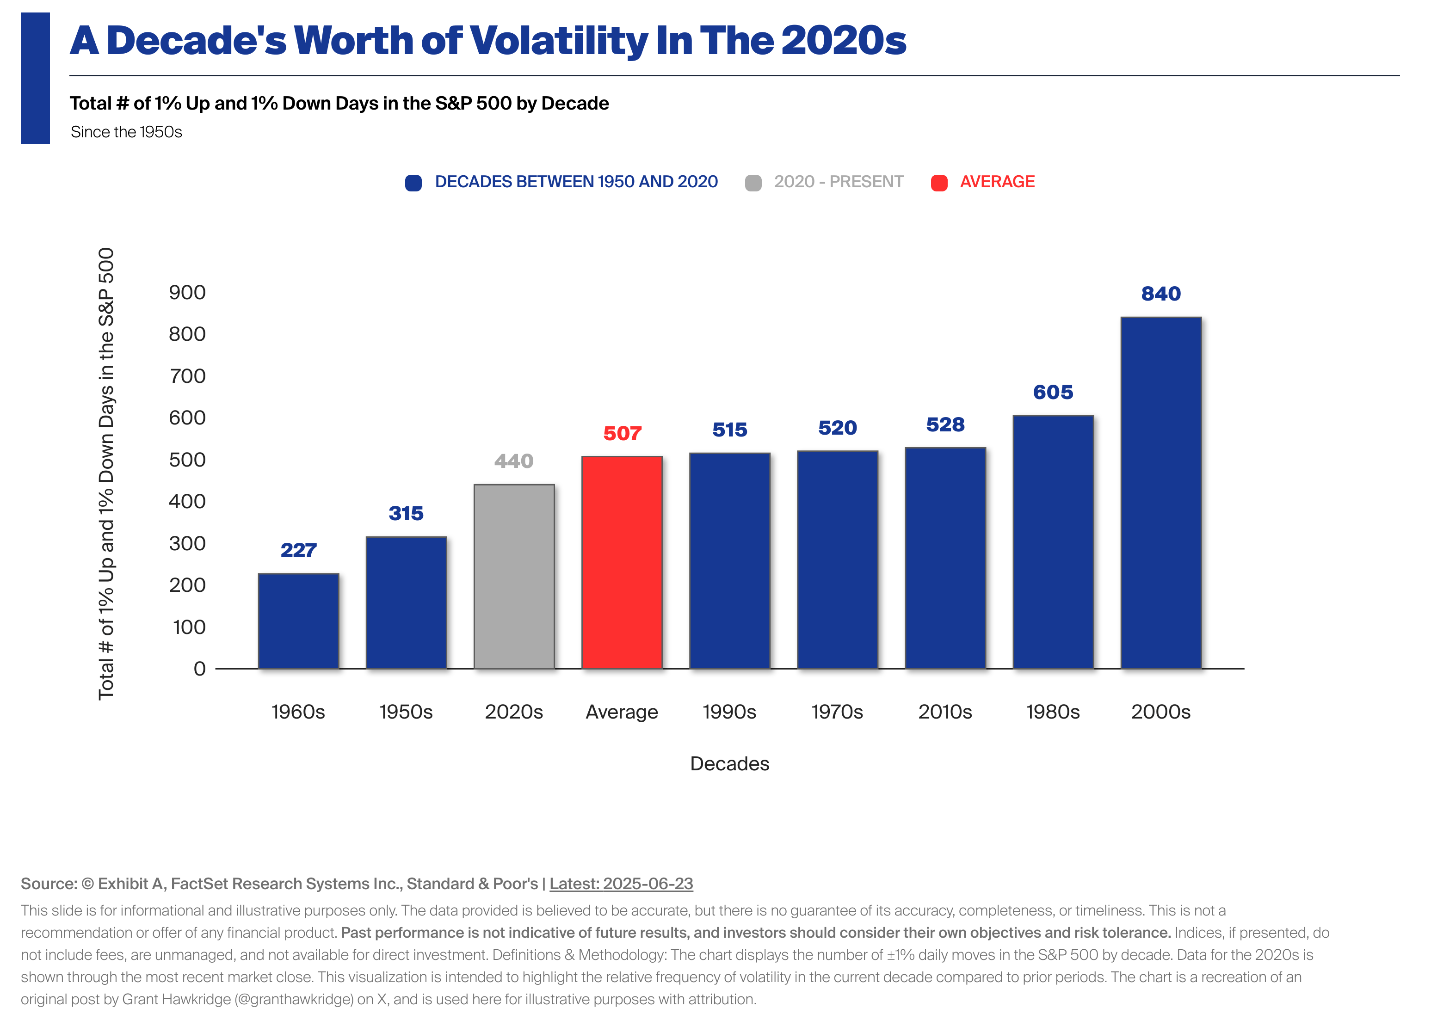
The takeaway: Volatility isn't just a passing phase - it's been a consistent part of market behavior in recent years. That doesn't mean investors should make dramatic changes, but it does highlight the importance of having a thoughtful, long-term plan. With clear goals and proper context, periods of market fluctuation can be managed more effectively. Let me know if you'd like to discuss how this aligns with your current strategy.
|